Capturing metrics using octrees
|
  |
|
|||||||
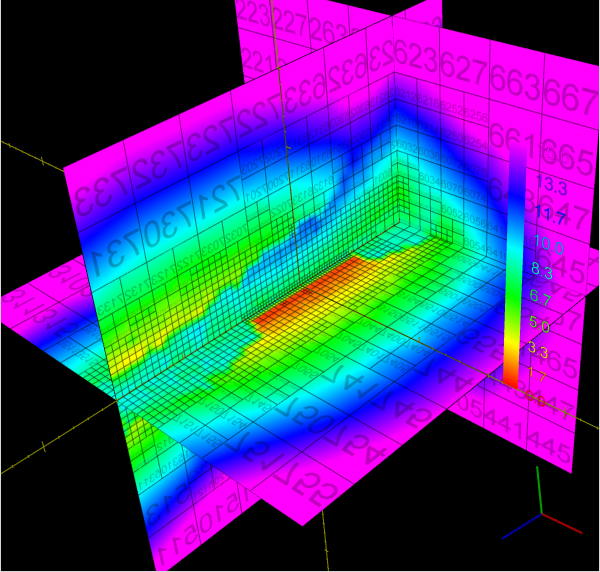
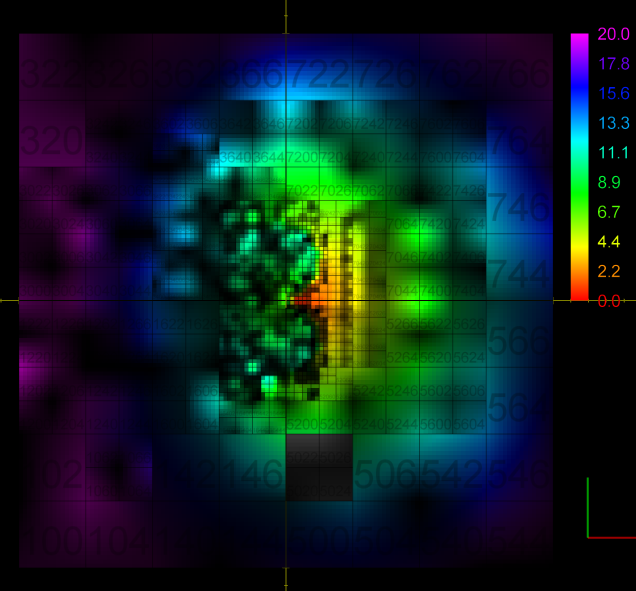
The abundance of samples in the "optimal" metric discovery led to the need of representing these functions efficiently. This work investigated the use of octrees/hypertrees for this purpose. In this approach samples are collected at the octree vertices, and trilinear interpolation is used to obtain function values in the intervening spaces. The images on the left demonstrate some simple captured functions. On the right is the captured "optimal" car metric; the (x,y,z) in the plot correspond to the car's relative longitudinal, lateral, and angular errors, respectively (i.e., (x,y,z) = q2 - q1, the difference in car configurations). The bottom right image is a link to an animation of the cross-section of the metric as one sweeps across the orientation axis. The process of function/metric discovery consists of first using some base uniform sampling grid to get a rough characterization, and then subdividing any cells which have more detail than the local linear interpolation reproduces. Since it is unlikely that a particular single sample-generating query will produce the shortest path between points (unless using an optimal path planner; usually not the case, as with RRT, PRM, etc.), there will be a fair bit of noise, and already-explored vertices might have to be resampled to obtain a lower estimate of the metric at that point. The choice of where and when to apply these refinement steps is currently done manually by inspection, but there is much room for automated solutions. In the above pair of images, at top, the left image shows the vertex value refinement and cell subdivision, while the right image shows "confidence" coloring of the function (brightness indicates resampling count), a likely tool in automating refinement decisions. |
|||||||||