Structure-Based Volume Rendering


Abtract: A scalar volume may be viewed as a function f(x) defined over some region of the three-dimensional space. In this work, we present a simple technique for rendering a class of subvolumes known as multiscale interval sets, which are specified by constraints of the form
                  a <= g(x) <= b.
We use dyadic wavelet transform to construct g(x) and derive subvolumes with the following attractive properties: (a) the subvolumes are very small but containing enough information for reconstructing the original volume, and (b) the shapes of the subvolumes provide a hierarchical description of the geometric structures of the data set. Numerically, the reconstruction in (a) is only an approximation, but it is visually accurate as errors reside at fine scales where our visual sensitivity is not so acute. We triangulate interval sets as alpha shapes, which can be efficiently rendered as semi-transparent clouds. Because interval sets are extracted in the object space, their visual display can respond to changes of the view point or transfer function quite fast. The result is a volume rendering technique that provides faster, more effective user interaction with practically no loss of information from the original data. The hierarchical nature of multiscale interval sets also makes it easier to understand the usual complicated structures in scalar volumes.

Key Words: Volume rendering, interactive techniques, multiresolution representation, data compression, visibility sorting, alpha shapes, wavelet transforms


Interval Set Construction

Figure 1: Starting from top left figure, the polylines indicate the the flow of construction process. (a) A slice of a CT volume. (b) The modulus of wavelet transform. (c) The curves of wavelet maxima. (d) The wavelet modulus reconstructed from normalized wavelet maxima. (e) and (f) Binary images of interval sets with different interval bounds.

Recovering Information from Interval Set

Figure 2: A volume (left) with its reconstruction from wavelet maxima (right).

Packing Interval Set

Figure 3: A working example for constructing the simplicial approximation of an interval set.

Rendering Examples


Click on the image above to see a full-size version

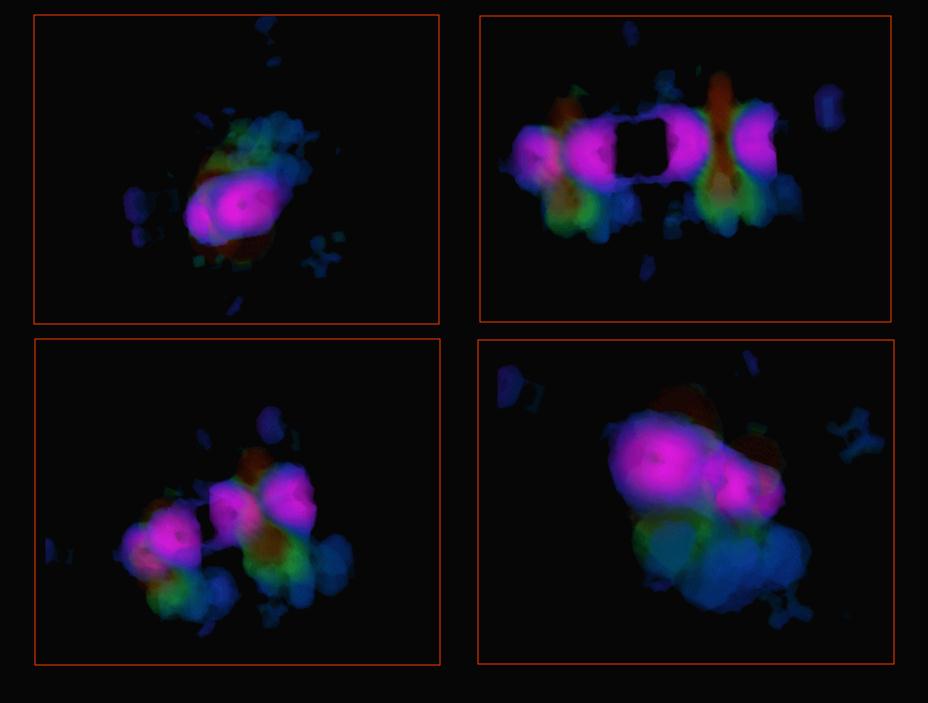
Figure 4: A fine scale critical subvolume representing the wave function of HIPIP.


Click on the image above to see a full-size version

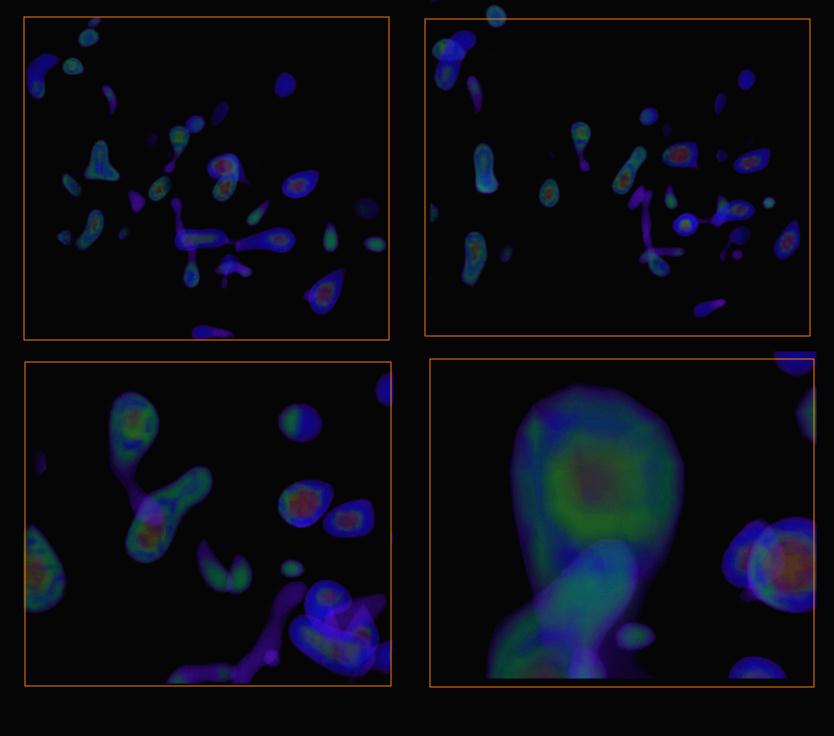
Figure 5: The volume inside an isosurface of a scalar volume representing the electron density of superoxide dismutase enzyme. Notice the zoom-in sequence on a small blob.


References: Guo, B., ``A Multiscale Model for Structure-Based Volume Rendering'', IEEE Trans. on Visualization and Computer Graphics, Vol. 1, No. 4, 1995

Acknowledgements:

I would like to thank Herbert Edelsbrunner for his willingness to share his insight in geometry. Many thanks to Nelson Max and Peter Williams for useful discussions. The implementation of tetrahedral packing is built upon the code kindly provided by Ernst Mucke. The HIPIP data set is from Louis Noodleman and David Case of Scripps Clinic, La Jolla, California. The SOD data set is from Duncan McRee of the same institution.
Last update : Dec. 28, 1996.

If images on this page look dark to you, see the note about gamma correction.

back to the main page