Training Data and Initialization
The walking model is trained with 158 frames of data sampled at approximately 70 frames per gait cycle. We initialize the GPDM by first projecting the training data to a low-dimensional latent space using PCA.
3D GPDM
GPDM determines positions of data in latent space by MAP estimation with prior given by the assumption of smooth dynamics. The left plot (Fig 2a) shows learned positions in blue, and mean-prediction simulations of the learned dynamics in red. The middle plot is a volumetric visualization of the pose precision; warmer colors indicate higher-confidence regions of the latent space (Fig 2b). The animation corresponding to the simulation (red curve) is shown on the right. We note that while the simulation goes through regions of high-confidence values in latent space, it rarely overlaps with training data. Therefore, the synthesized animation is a visualization of poses nearby, but not the same as training data in latent space.

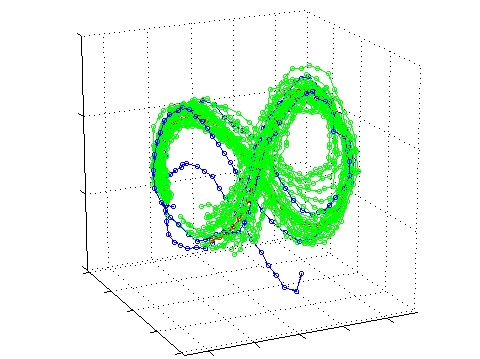
Plots of fair samples generated from the above 3D GPDM using hybrid Monte Carlo simulation (added on July 4th, 2005). The sample trajectories are 60 samples long (slightly less than one cycle) and are plotted in green.. Click on the figure below to see an animation of the 3D plot.